


Here are some of the useful bits on the Internet, and some things I have put together about the SARS-CoV-2 virus and Covid-19 illness.
Deaths/million of population may be a better statistic than the fatality index, as deaths are more concrete than just test results, and it is possible that dead people are more likely to be tested than live ones at the moment(!):
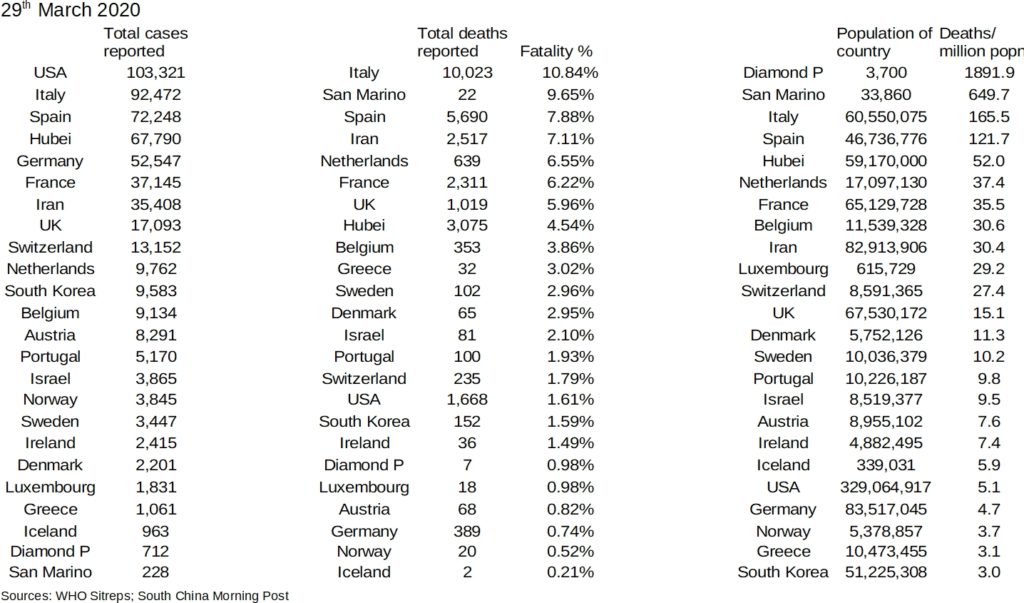
I have put in Hubei, because the whole of Mainland China didn’t have an epidemic, it was mostly just in Hubei Province…so their death rate was 50/million, ours is currently 15.1/million, S Korea is at 3/million, and Italy 165/million…are we going to keep it below Hubei (China)? Will we be as high as Italy (still further to go in Italy)? We can certainly not attain what S Korea have: a fifth of our death rate, and they are well past the peak, whilst we look like having a way to go before our peak!!
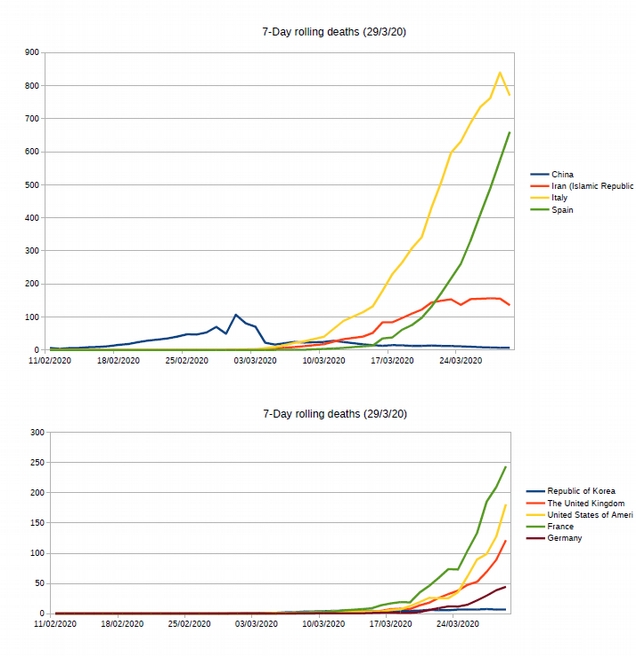
Here are the death graphs…look at Italy!! (Click on the graph for an enlargeable pdf.)
News Thursday evening 19th March 2020:
https://www.euronews.com/2020/03/18/italian-doctor-dies-of-coronavirus-after-working-without-gloves-due-to-shortage
…although 99% of Italian Covid-19 deaths were of people with other conditions:
https://www.scmp.com/news/world/europe/article/3075851/coronavirus-italy-says-99-people-who-died-had-other-illnesses
World Health Organisation: daily situation reports
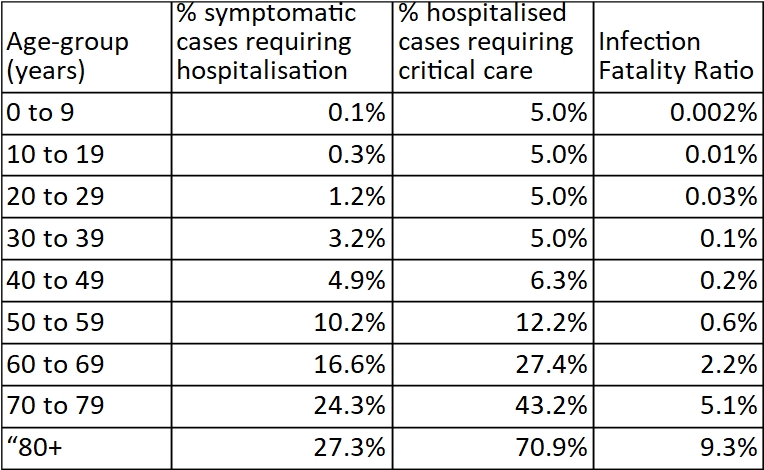
Imperial College study modelling the spread of Covid-19 in the UK based on China, Korea, Italy, UK and USA – used by the Johnson govt to inform their policies.
One interesting bit from there is the “case severity” (see table); 2.2% death rate 60-69 year-olds, 5.1% in 70-79 year-olds, 9.3% in 80+ (i.e. 90.7% survival rate in 80+).
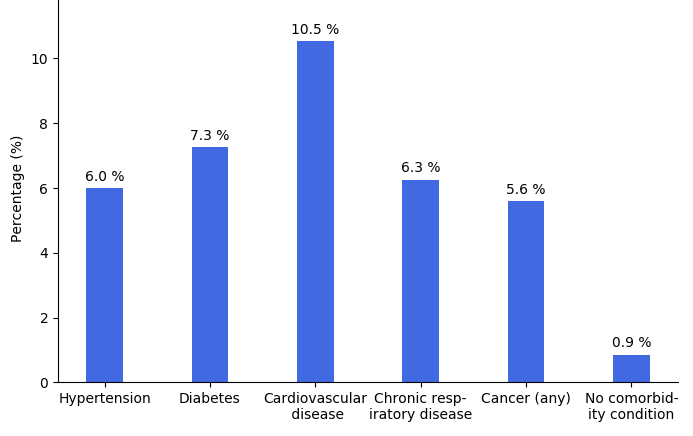
Wikipedia Covid-19 coverage. This includes a different take on case severity (re deaths):
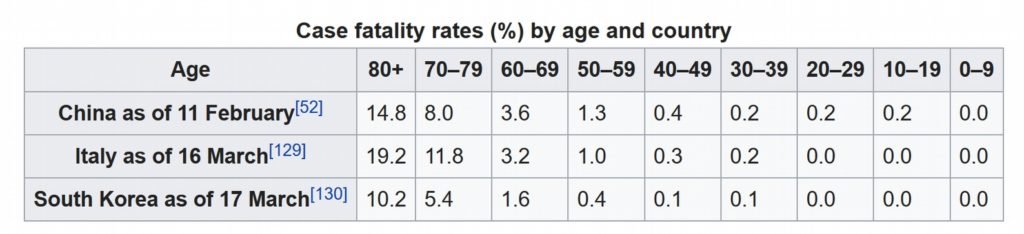
… and then case severity given other diseases…and for those with no “co-morbidity”, 0.9% fatality rate per diagnosed case.
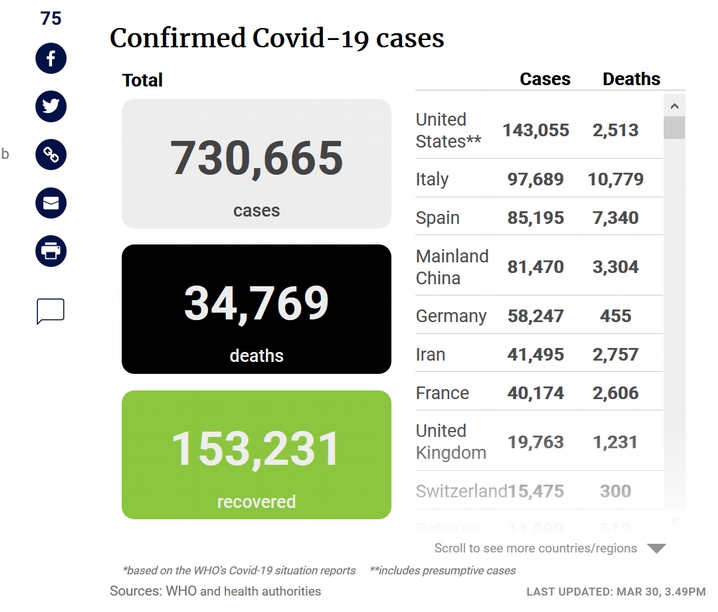
The South China Morning Post covers Covid-19 really effectively, along with a “counter” that is within articles (I haven’t found how to access it on its own) but is kept bang up to date (based on WHO sitrep nos.).
The Guardian Covid-19 maps and graphs.
Public Health England numbers, graphs and “details” of infections in the UK (seems to be at least one or two days out of date, and poor detail on graphs and locations…)
The French “Attestation de deplacement” – their form that everyone has to prepare and carry with them whenever they step out of the door…